Pixel images transferred to spreadsheet.
After working with openpyxlI found you could manipulate the cell styles using python. So I worked on a little
script to draw a png image pixel by pixel to individual cells in a spreadsheet. It turned out to be an amusing project.
This is what I started with:
![]()
And I was able to get this:
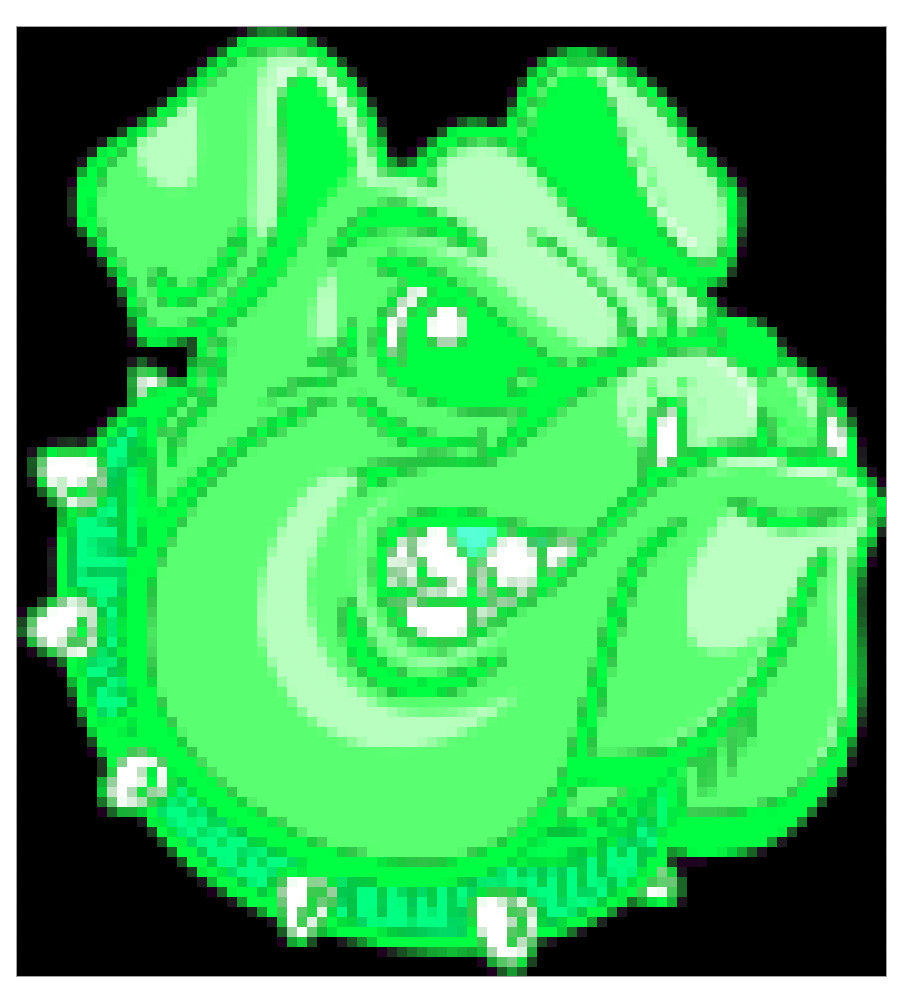
So the problems in front of me were:
- I had to get the pixel data out of the image.
- I had to convert them to something openpyxl could read.
- Figure out how to create to a new spreadsheet object. With enough cells to render the image.
- Format the cells with the right size and color.
The first problem I had some experience with. I've used Pillow in the past. Pillow allows you to use Python to manipulate and read the data from an image. The hardest part was converting the RGBA values from each pixel to hex color codes. openpyxl only takes hex codes. I converted the values to hex using the Python string format function
I found this clever code on Stack Overflow. It uses a string formatting i've never used. So I had to learn what it did.
"{:02x}{:02x}{:02x}".format(r, g, b)
This is the magic of the string format function.
The curly braces signify that everything inside will be replaced.
The Colon is the format_specIt defines how individual values are presented. In this case it's coupled with the 02x The x means the values passed in via the format function will be interpreted as Hex values.
The 02 means each value will be preceded by a zero.
So when we add integer values instead of r, g, b we get this:
"{:02x}{:02x}{:02x}".format(209, 50, 70) == 'd13246'
Another option in the format function is binary.
It looks like this:
"{:b}{:b}{:b}".format(209, 50, 70) == '110100011100101000110'
With this function I converted all the RGB value in the image to Hex values. Openpyxl colors the cells using the hex values.
So the first two problems were solved. Got the pixel data out of the image. Then convert them to the right form.
For the third problem, I found creating an openpyxl workbook and then a worksheet to be straightforward.
    workbook = Workbook()
    worksheet = wb.active
From here you can simply add cells as needed.
worksheet.cell(1, 5) = PatternFill('solid', 'some hex color)
Opening this spreadsheet in Excel will show a colored cell in column A row 5.
This is how you format a cell. PatternFill is the color object for openpyxl objects. So each cell gets a new
PatternFill with the hex code's I generated from the original image.
The final problem was solved by generating a list with lists that contain the x and y coordinates of the pixel and
the color.
data = [[30, 99, "000000"]]
Then I used the HEIGHT and WIDTH from the original image to iterate through all cells and fill in their
color.
    for i in cells:
        ws.cell(i[0] + 1, i[1] + 1).fill = PatternFill('solid', fgColor=i[2])
I had to add 1 to the cell count, because spreadsheet columns and rows start with 1. Python lists start from 0.
The cell list I generated using the height and width of the original image to create a cell for eah pixel.
After some trial and error and a bunch of debugging and reading documentation I was able to render a small PGN into a spreadsheet. Pretty cool! This has no real-world application, but it was fun.
And it has a color problem. As you can see, the colors are yellows, greens and some off white. Openpyxl can do
more colors than that. I suspect my color conversion is off.
But I kinda like the way it turned out. So I left it for now.
It's a bug I'll have to work out.
Here's a link to the code wrote spreadsheet art script